


Modeling blood vessels is one of the main interests in computational simulation of hemodynamics. By materializing the geometry of certain blood vessel cases and running simulations, we can obtain a tremendous amount of data regarding certain afflictions such as aneurysm and stenosis. However, accurate modeling of the circulatory system is still a challenging objective. There are many technical difficulties to overcome in simulating blood flow, including the non-Newtonian properties of blood, the complicated shapes and elasticity of vessels and the pulsatile blood flow [1,-4].
Researchers have dedicated effort to developing accurate methods for circulatory system modeling by simplifying or approximating properties that are difficult to precisely imitate [5,-8]. One of these simplified methods includes an assumption which regarded blood as a Newtonian fluid, ignoring its characteristics and treating it as a water-like liquid. Also the usage of simple boundary conditions is inevitable, since the complicated vessel shape of the entire vascular system can neither be measured nor materialized completely.
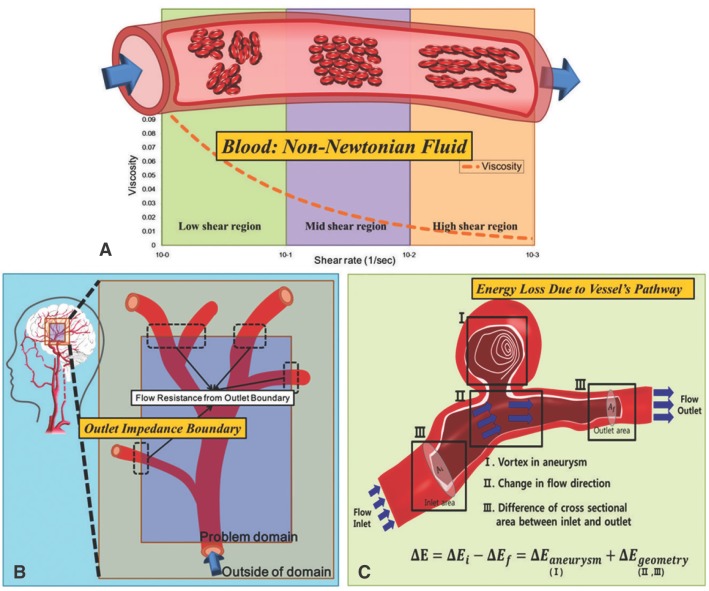
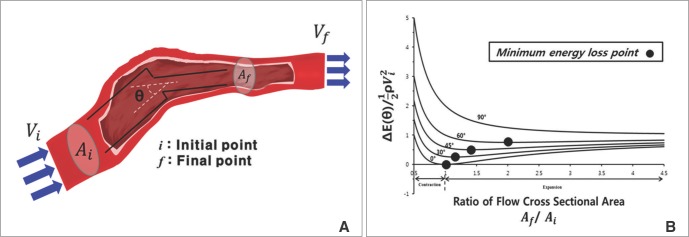
Based on the recent articles published in Stroke [9,-12], we identified three major weak points which are overlooked in the computational modeling and simulation processes of the circulatory system. First, the non-Newtonian property is scarcely applied to blood flow. As blood is not a pure liquid but rather a compound of tissue particles such as red blood cells, its viscosity differs greatly with change in shear rate (Fig. 1A). The second consideration is the inappropriate outlet boundary conditions of simulation models. The effect from outside of simulation domain, including backward pressure by wave reflection, must be considered at the outlet boundary for precise modeling (Fig. 1B). Third, when energy loss term is used in result analysis, the effect by vessel's geometry itself is not reflected properly. Blood flow properties are affected not only by abnormal vessel conditions such as aneurysm, but also by the cross-sectional area or directional change of blood vessels. These factors must be considered for accurate calculation of energy loss (Fig. 1C).
These technical issues have emerged to the surface partly due to recent progress of computational simulation methodology. In this paper, the three main modeling considerations are pointed out in detail. The importance of these three categories is explained thoroughly by numerical explanation and comparison with the works of other researchers.
Non-Newtonian Properties
Blood is a non-Newtonian fluid or more precisely, a pseudo-plastic fluid [13]. This type of fluid is less like water and more like toothpaste or ketchup, flowing more smoothly as the velocity of flow increases. This smooth flowing phenomenon at higher velocity is related with decreased viscosity and increased shear rate of the blood. Such phenomenon is called as the shear thinning behavior of the blood as a non-Newtonian fluid (Fig. 1A).
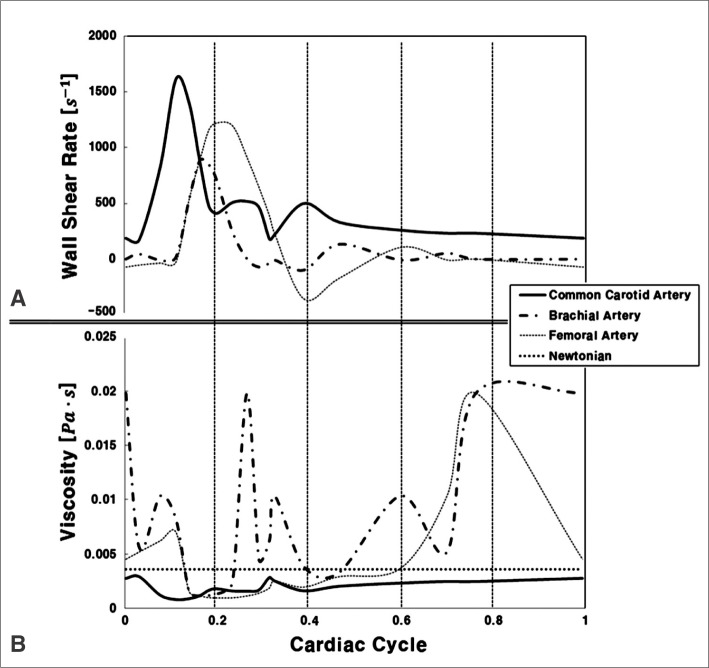
Blood flow is pulsatile; therefore, properties such as pressure, velocity, flow rate, and viscosity change as a function of time. Wall shear rate is also a function of time (Figs. 2A, B), indicating that if wall shear rate changes, viscosity might also change. This phenomenon cannot be explained with Newtonian assumptions. However, the Carreau-Yasuda model, one of the non-Newtonian models, demonstrates the change in viscosity according to time (cardiac cycle). This is an important reason why non-Newtonian analysis must be used in the pulsatile cardiac conditions.
Several studies have emphasized the importance of this non-Newtonian behavior of blood by comparing Newtonian and non-Newtonian modeling research. Gijsen et al. [14] showed that applying non-Newtonian fluid flow at arteries with bifurcations greatly affects the flow features compared to Newtonain fluid flow. Molla and Paul [15] also compared Newtonian and non-Newtonian models in their research of arterial stenosis. Application of non-Newtonian properties was emphasized at specific diseases such as aneurysm. Wall shear stress, which is one of the most important factors for diagnosis of aneurysm, is the function of viscosity and shear rate. Assuming blood as Newtonian fluid means that the effect of viscosity term is ignored. Fisher and Rossmann [16] compared analysis of wall shear stress (WSS) distribution at aneurysm with both non-Newtonian (Casson, Carreau, Power law) and Newtonian models. The result showed that WSS of non-Newtonian models is more influential in aneurysms than that of Newtonian model. Also, Kim et al. [17] applied non-Newtonian properties to the analysis of stents in aneurysms, proposing that viscosity and velocity profiles in the aneurysm are largely determined by non-Newtonian properties of blood flow.
Outlet Boundary Condition
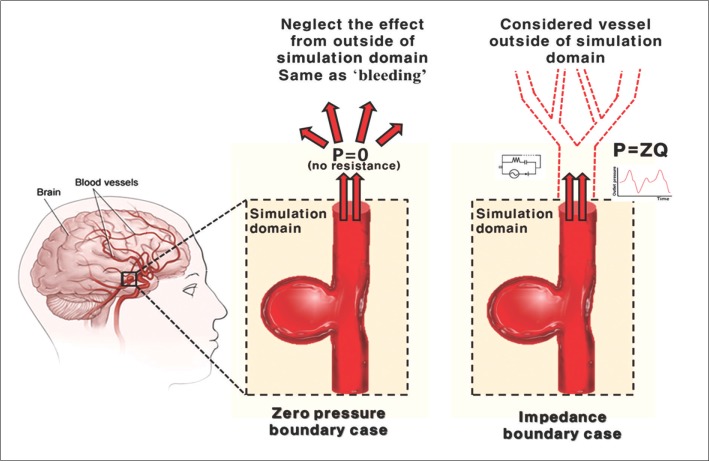
Boundary conditions are the given conditions at the domain boundaries and which account for outer domain properties, are one of the most important factors for a modeling process. As the simulation domain is restricted to only a small proportion of the total circulatory system, the conditions outside of the domain cannot be directly applied to the simulation. Directly measured properties from a specimen may be applied at the boundaries; however, it is difficult to fully demonstrate the entire vascular system due to the problems of universality, simplicity, and technical deficiency. Simplified numerical boundary conditions are instead applied in most circulatory system modeling. There are several methods for selecting the outlet boundary condition. The' zero pressure outlet' or 'traction-free'boundary condition is used in various models due to its simplicity [18]. However, when the purpose of modeling is to analyze blood flow, the zero pressure outlet should not be used due to its inaccurate simulation results. The zero pressure boundary is as akin to assuming that the vessel is cut and exposed to atmospheric air conditions. Therefore, it neglects the change in pressure and flow rate by' wave reflection' from downstream vessels, resulting in considerable difference from actual blood flow.
Wave reflection is an influx of blood due to the reflected wave from downstream arteries. This is mainly due to the pulsatile flow of blood and elasticity of blood vessels. As pulsatile antegrade flow passes through the elastic vessel, this vessel repeatedly shrinks and expands, causing retrograde flow through the whole vascular system. This wave reflection results in considerable changes in blood pressure and flow rate due to overlap with the forward flow of blood. This wave reflection can be used in diagnosis of cardiovascular disease. As wave reflections and arterial stiffness are associated with an increased risk of cardiovascular disease, the measurement of central arterial pressure can provide a valid aid in cardiovascular risk assessment [19,, 20].
To demonstrate this wave reflection, the term 'impedance'is applied to outlet boundary conditions. The well-known outlet conditions in theoretical hemodynamics include resistance, Windkessel, and impedance boundary models [18].
Resistance model substitutes the outer domain vessels into one single variable, while Windkessel model uses three variables [21]. These two models can develop wave reflection phenomenon, yet still inappropriate because it cannot show the arrival time of wave reflection correctly. However, impedance boundary model reflects the entire vessel geometry and property. By constructing the 1D vessel system that represent the real vessels, the variable called 'impedance' is calculated from the peripheral blood vessel to the boundary of simulation domain. Unlike the other models, this impedance variable includes both the data of magnitude and arrival time of wave reflection [18]. Because it considers wave reflection from bifurcations and geometry of vessels, the impedance model successfully demonstrates the pulsatile aspects of real blood flow. Comparison of zero pressure boundary condition and impedance boundary condition is shown in Fig. 3.
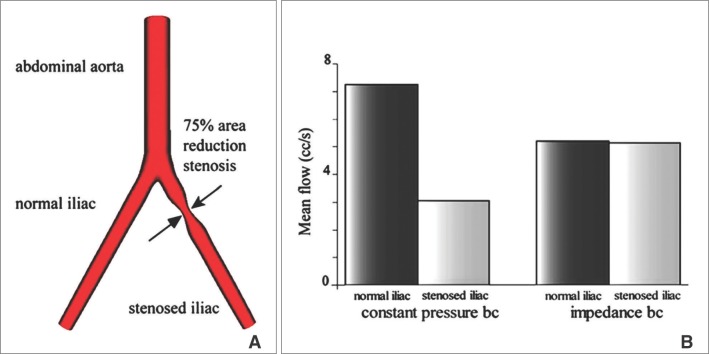
The difference of those two boundary conditions compared in a vessel mentioned in Fig. 3, was clearly demonstrated by Vignon-Vlementel et al [18]., as shown in Fig. 4. When there is 75% area reduction stenosis in a branch of the bifurcation vessel model, mean flow of constant pressure boundary condition is divided into 70% and 30% each, because the fluid resistance by the geometry of computational domain is only considered. For the impedance boundary condition, on the other hand, the flow is also affected by entire circulatory system so that the difference between those two vessels is smaller than that of the constant pressure boundary condition. These results agree with representative clinical observations for iliac artery stenosis with less than an 85% area reduction [18]. For these reasons, the wave reflection should be considered to perform an accurate simulation for the purpose of analysis.
Energy Loss Due to the Vessel's Pathway
Interpreting computational results is as much important as performing accurate simulation. There are various ways to interpret simulation result data, such as plotting pressure and flow rate or calculating wall shear stress [16]. One of the possible methods is energy loss analysis. As the loss of energy is equal to the amount of energy applied to the vessel wall, it is directly related the risk of conditions such as the rupture of aneurysm [12,, 22,-24]. However, there are many factors, which are mostly related to the geometry of vessel, to be considered when using the energy loss equation. It might cause a considerable error on result if those factors are not reflected properly.
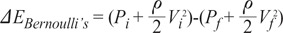
To predict clinical treatment effects, Bernoulli's energy loss concept is used [25]. If Pi, Vi are pressure and velocity at the initial cross sectional area domain respectively and Pf, Vf the pressure and velocity at the final cross sectional area domain, then the energy loss equation can be written as:
This Bernoulli's energy loss is purely due to mechanical energy loss. The energy loss consists of a limited number of ' loss factors', so some papers have already claimed that it cannot be applied in all clinical pathologies such as aneurysms or stenosis [25,-27]. As energy loss can change by depending on its geometrical conditions, the following issues should be considered when using the loss term.
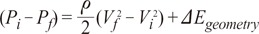
The main properties of energy loss by the pathway of blood are the change in cross sectional area and the direction of flow axis, based on Bernoulli's equation and momentum conservation [26,, 28]. From Fig. 5A, if ΔEgeometry is the energy loss from a change in geometry, such as cross-sectional area or directional change, then the mechanical energy balance (Bernoulli's equation) is
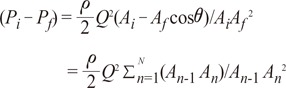
Also, the force-momentum relationship (momentum conservation) is
where Žü is density of blood, ╬Ė is angle change in direction, Q is flow rate (m3/s) and A is cross sectional area. Using Equations 2 and 3, we can derive the following equation:
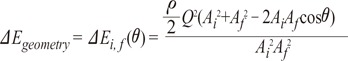
From Equation 4, energy loss can occur due to change in cross-sectional area or flow angle. Fig. 5B shows this relationship between energy loss and change of cross sectional area or angle. The velocity difference at initial and final points is related to the momentum conservation equation, Δ(mv)=Ft, where m is mass, v is velocity, F is force and t is time. A change in 'mv' means that force is applied and the velocity and direction of blood flow are changed by the force of collisions with the vessel wall. The altered velocity and direction result in a change in fluid properties, which are directly related to energy loss.
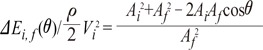
Fig. 5B shows that energy loss is also affected by changes in cross sectional area and flow angle. The larger the flow angle changes, the larger the energy loss becomes. In the case of vessel contraction, the larger the change in cross-sectional area, the larger energy loss is. The dots presented at 0-60 degrees represent the cross-sectional area where energy loss is at a minimum. Energy loss tends to decrease until its minimum value, then increase again. As, energy loss approaches  the cross-sectional area change is larger at each change of angle. In the case of a change in 90┬░, energy loss decreases to without a minimum value.
the cross-sectional area change is larger at each change of angle. In the case of a change in 90┬░, energy loss decreases to without a minimum value.The level of change in cross-sectional area and direction of flow also affects energy loss. This means that if the rate of change in cross-sectional area or the angle of path is larger, then the value of energy loss also increases [26,, 29].
A. Change in cross-sectional area but no alteration in direction of flow
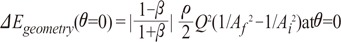
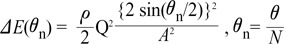
We can rewrite Equation 7, ╬öEgeometry (╬Ė=0) = function of ╬▓┬ĘBi,f , Bi,f = 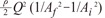 , which is term of Bernoulli's equation.
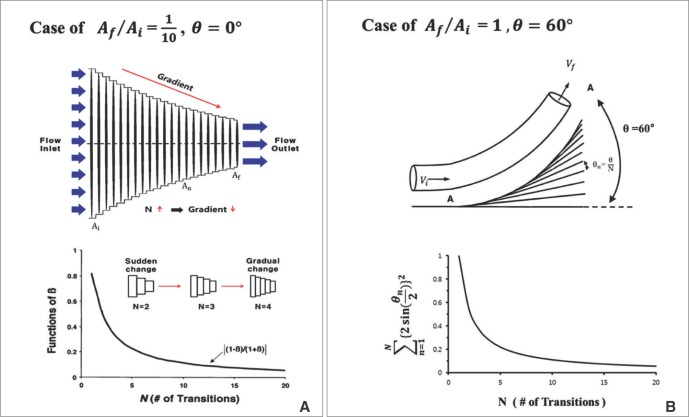
, which is term of Bernoulli's equation.In Fig. 6A, it is assumed that the vessel having some gradient of cross sectional area is divided by' N' number of steps. Then the momentum conservation between steps (n-1) and (n) can be written as Equation 8.When ╬Ė=0, from Equations 2 and 6, Equation 7 can be derived to find the value of ╬öEgeometry by using '╬▓ = =
=  ' which represent cross-sectional area ratio.
  is from the Bernoulli's equation and
  is the loss factor based on ratio of change in cross sectional area. As observed in Fig. 6A, gets smaller with increasing N, meaning that the greater the cross-sectional area changes, the less the energy loss is.
= ' which represent cross-sectional area ratio. is from the Bernoulli's equation and is the loss factor based on ratio of change in cross sectional area. As observed in Fig. 6A, gets smaller with increasing N, meaning that the greater the cross-sectional area changes, the less the energy loss is.B. No change in cross-sectional area but an alteration in direction of flow
When the angle changes by 'N' number of steps, the energy loss between n-1 and n steps is demonstrated by Equation 8 which is derived from Equation 4:
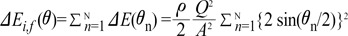
╬öEi,f (╬Ė) is  multiplied by 'energy loss factor'. This factor decreases as N increases (Fig. 6B). To sum up, the energy loss decreases as the angle change becomes more gradual
multiplied by 'energy loss factor'. This factor decreases as N increases (Fig. 6B). To sum up, the energy loss decreases as the angle change becomes more gradual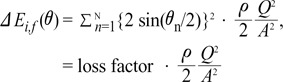
It has been shown that, even without an aneurysm there is energy loss due to the geometry of the vessel itself. Hence, energy loss near an aneurysm consists of loss from the aneurysm itself and the loss from the geometry of the vessel, expressed as ΔE=ΔEaneurysm+ΔEgeometry. These equations show that the geometry of vessel must be considered when using the energy loss in diagnosis.
SUMMARY
Three important modeling considerations that are rarely used in circulatory system modeling are explained in this paper. The non-Newtonian properties of blood are found to be critical for the accuracy of modeling. Choosing the appropriate outlet boundary condition also makes an important difference in the results of a simulation. Finally, the energy loss related with blood vessel geometry must be included when the energy term is used in numerical calculations.
There are many researchers developing better modeling techniques and numerical methods, yet these new methods are not routinely applied in circulatory system modeling. Establishing accurate and trustworthy modeling of the circulatory system requires the newest techniques and implementation.