Assessment of Blood Clot Composition by Spectral Optical Coherence Tomography: An In Vitro Study
Article information

Abstract
Purpose
Optical coherence tomography (OCT) has the potential for in vivo clot composition characterization in difficult mechanical embolectomy cases. We performed an in vitro study to determine the OCT characteristics of red blood cells (RBCs) and fibrin rich clots.
Materials and Methods
Analogues of 5 compositions of clots (5% to 95% RBCs from Group A to E) were created from human blood. The blood mixture was injected into the bifurcation of a 3D printed bifurcated silicone tube. The OPTISTM Integrated System (St. Jude Medical Inc.) was used to identify the magnitude of OCT signals from different compositions of clots. Martius Scarlett Blue trichrome (MSB) staining was performed to confirm the composition of RBCs and fibrin in each clot.
Results
Group A and B showed less signal attenuation (less than 30%) from its surface to the inside, which indicated high penetration (low-back scattering). Group C indicated intermediate signal attenuation (60%) from its surface to inside the clots, in which signals were found even at the periphery of the clot. Group D and E were superficially signal rich with more signal attenuation (more than 80%) from its surface to the inside indicating low penetration (high-back scattering). Signal-free shadowing was shown in 3 clots in Group E. MSB staining indicated color change (from red in fibrin-rich clots to yellow in RBC-rich clots).
Conclusion
Different compositions of clots can be assessed using OCT. Fibrin-rich clots have homogeneous signals with high penetration, while RBC-rich clots can be recognized as superficially signal rich with low penetration.
INTRODUCTION
The fundamental principles of optical coherence tomography (OCT) evolved from optical low coherence reflectometry. Intravascular OCT requires a single fiber optic wire that both emits light and records a reflection while simultaneously rotating and being pulled back along the artery. The image is formed by the backscattering of light from the vessel wall or the time it takes for emitted light to travel between the target tissue and back to the lens, producing an “echo time delay” with a measurable signal intensity or “magnitude” [1].
OCT cannot visualize vessel wall structures under the condition of blood flow because OCT signals are attenuated by red blood cells (RBCs). Therefore, it is often necessary to establish a blood-free environment for OCT light penetration to the vessel wall. Conversely, based on this optical characteristic, it might be possible to demonstrate an occlusive thrombus as protrusion with signal attenuation within the vessel lumen without blood removal because a thrombus, even a white thrombus, contains red blood cells to some degree [2]. The use of OCT for differentiation of clot composition in cardiac patients has been reported [2]. We tried to further validate its use for differentiation of varied types of blood clots seen in stroke patients using in vitro clots with different percentages of RBCs and fibrin. This is potentially important as OCT could become a valuable tool for device selection, particularly when dealing with emboli which are refractory to certain techniques [3,4].
MATERIALS AND METHODS
Clot analogue creation
Following Institutional Review Board approval from our institute, whole blood was obtained from volunteers from the Blood Transfusion Service. Blood was separated into plasma, buffy-coat, and erythrocyte-rich layers after centrifugation. The plasma and erythrocytes were harvested independently and then recombined in controlled ratios to form 5 different clot analogues with 2.06% calcium chloride and 2% thrombin added (5 analogues for each composition): Group A, fibrin-rich (95% plasma: 5% RBCs); Group B, fibrin-rich (75% plasma: 25% RBCs); Group C, intermediate (50% plasma: 50% RBCs); Group D, RBC-rich (25% plasma: 75% RBCs,) and Group E, RBC-rich (5% plasma: 95% RBCs) (Fig. 1A, B).
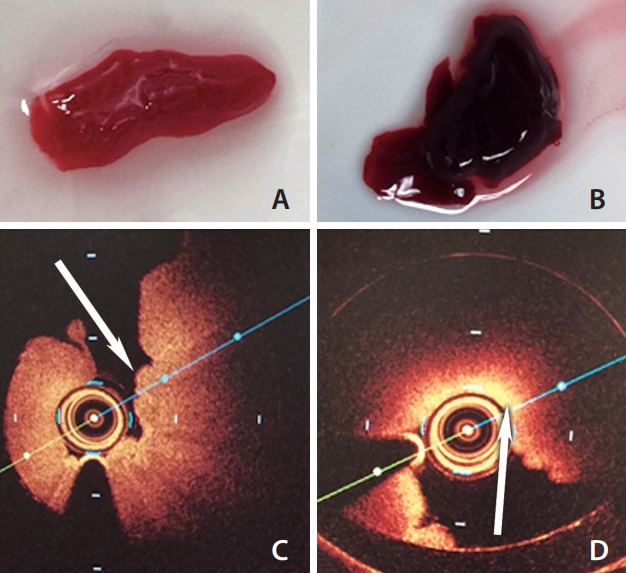
(A) Fibrin-rich clot (25% RBC); (B) RBC-rich clot (95% RBC); (C) OCT image from (A) showing less signal attenuation from the surface (white arrow); (D) OCT image from (B) showing more serious attenuation (white arrow). RBC, red blood cell; OCT, optical coherence tomography.
In vitro OCT
The blood mixture was injected into the bifurcation of a 3D printed bifurcated silicone tube based on aortic bifurcation in a rabbit through a 6F guide catheter. The OPTISTM Integrated System (St. Jude Medical Inc., St. Paul, MN, USA) was used to perform OCT testing for each clot. A Dragonfly™ OPTIS™ imaging catheter (St. Jude Medical GmbH, St. Paul, MN, USA) was advanced into the guide catheter to pass the clot (Fig. 2). Iodinated contrast media (Omnipaque 300; GE Healthcare, Chicago, IL, USA) was injected into the bifurcation with 3.5 mm in diameter to flush out blood in the clot area. The rate of automatic pullback was 10 mm/second. The pullback length was 5.4 cm.
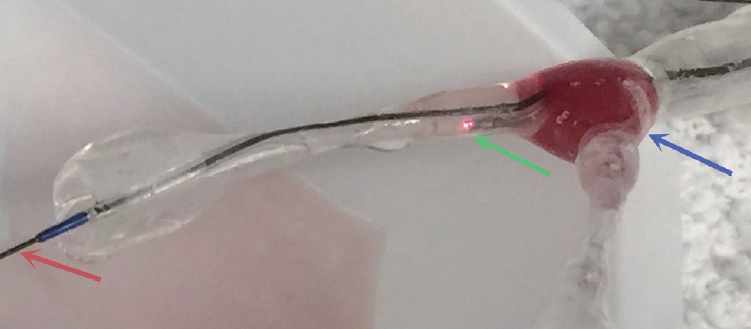
Showing clot location (blue arrow), a high-resolution camera inside the OCT catheter (green arrow), and catheter advancement over the microguidewire (red arrow). OCT, optical coherence tomography.
OCT image analysis
The blood clot was identified by OCT on mass images with different signal characteristics. OCT images were analyzed according to the magnitudes of signal attenuation from the surface to the inside of different compositions of clots. OCT scan images of the clots were exported and converted into 8-bit greyscale images. Images were then processed with the ImageJ software package (http://rsb.info.nih.gov/ij/), and reflectivity profiles were extracted from 2 regions of interests: one (ROI 1) was located at the surface of clots near the center of vessel lumen, another (ROI 2) was at the peripheral near the vessel wall (inside). Measurements were performed at those 2 regions, and the difference between the signal values at ROI 1 and ROI 2 was divided by the value at ROI 1 to get attenuation percentage (%). Mean OCT signal attenuation percentages between different groups were compared using the Student’s t-test.
Histologic analysis
Clot analogues were fixed in 10% phosphate-buffered formalin after OCT Imaging for 48 hours. Following tissue processing and embedding in paraffin, clot analogues were sectioned into 3-micrometer slices and stained with Martius Scarlett Blue trichrome (MSB). Slides were then scanned and quantified using Orbit Image Analysis software. Our quantification method has been published in detail [5]. In each prepared slide, the percentage of components including RBC and fibrin/platelet was calculated.
RESULTS
A variety of signal attenuation values were acquired from different groups. The changing curve of mean OCT signal attenuation percentages is shown in Fig. 3.
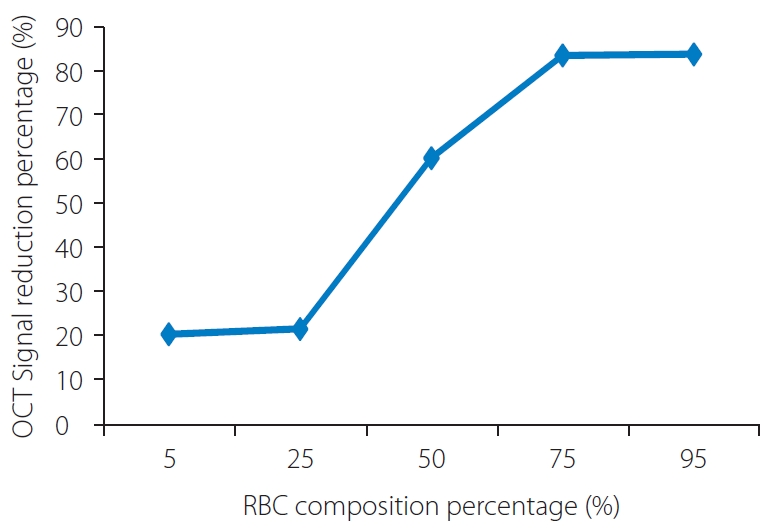
Correlation between RBC composition and OCT signal reduction. RBC, red blood cell; OCT, optical coherence tomography.
Fibrin rich clots
A homogeneous signal of clots was shown in all clots in Group A and B, and less signal attenuation (20.4±6.6% and 21.6±11.2%, respectively) from its surface to inside was noted, which indicated high penetration (low-back scattering) (Figs. 1C, 4A, 4B).
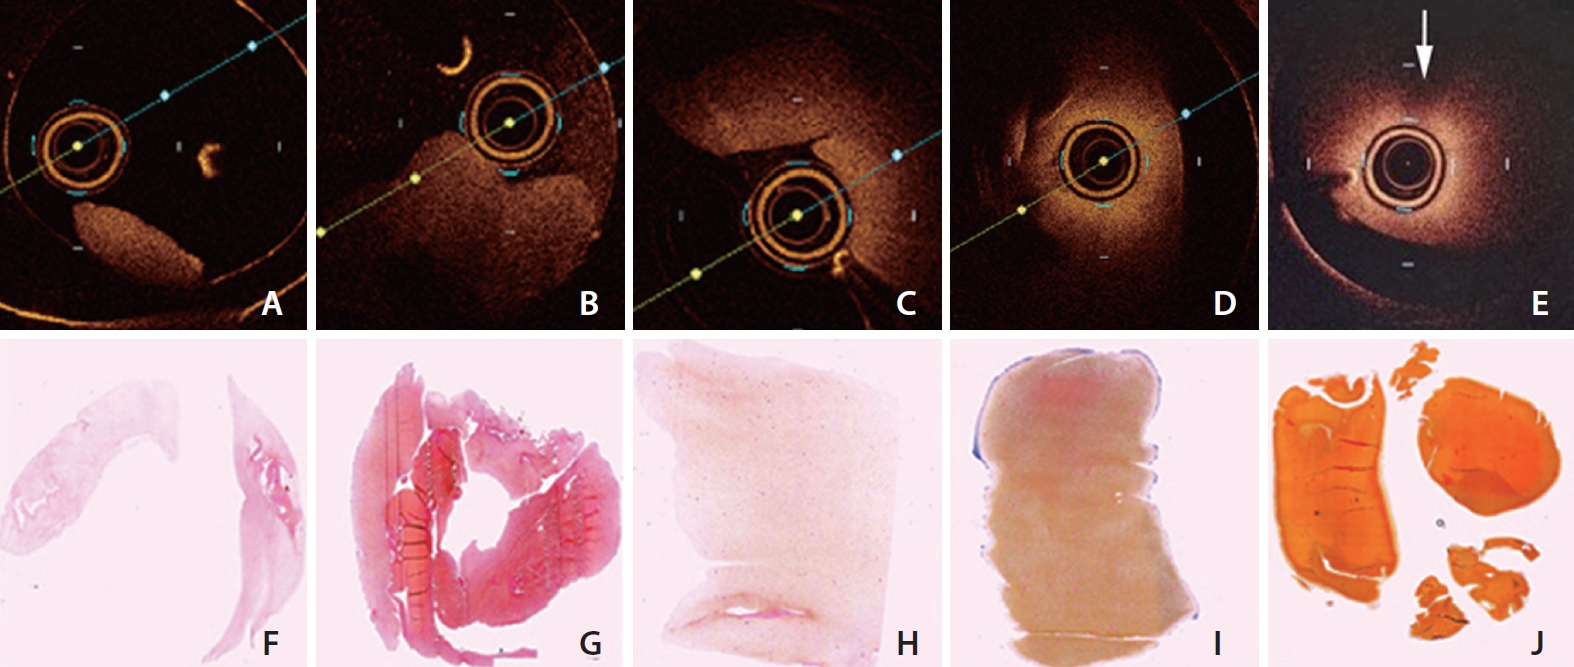
Representative OCT images of different types of clots. (A) 5% RBC rich; (B) 25% RBC rich; (C) 50% RBC rich; (D) 75% RBC rich; (E) 95% RBC rich. Signal attenuation is increased from (A) (low-backscattering) to (E) (high-backscattering). Signal-free shadowing is shown in 95% RBC-rich clot (white arrow in E). Representative histological images (F–J) of 5 types of clots (MSB staining, ×20); from left to right, the percentages of RBC were 14.4%, 31.7%, 49.3%, 77.1%, and 95.4%, respectively. The color of the clot area changes from light red to dark yellow. RBC, red blood cell; OCT, optical coherence tomography; MSB, Martius Scarlett Blue trichrome.
Mixed clots
Intermediate signal attenuation (60.4±12.1%) from its surface to inside was shown in all clots in Group C, in which some signals still existed at the periphery of the clot (Fig. 4C).
RBC rich clots
Clots in Group D and E were superficially signal rich with more signal attenuation (83.7±2.6% and 84.0±3.1%, respectively) from its surface to inside, which indicated low penetration (high-back scattering) (Figs. 1D, 4D, 4E). Three clots in Group E showed signal-free shadowing (Fig. 4E).
Histological appearances
For MSB staining, red areas show the presence of fibrin, which was indicated in fibrin-rich clots (Group A and B, from light red [Fig. 4F] to red [Fig. 4G]); whereas RBCs appeared yellow, which was indicated in RBC-rich clots (Group D and E, from yellow [Fig. 4I] to dark yellow [Fig. 4J]). Group C (intermediate) showed a mixed color (Fig. 4H), which indicated a transition from red to yellow.
DISCUSSION
Our in vitro study examining OCT imaging characteristics of various clot analogues and found that OCT can be used to differentiate clots that are rich in RBCs from those which are fibrin rich. This was likely a reflection of the fact that RBCs are highly reflective of OCT signals. Interestingly, fibrin rich clots were highly signal rich, and they showed very high penetration of signal. These findings are important as they highlight a potential role for OCT in the management of difficult thrombectomy cases.
The OCT light source uses a bandwidth in the near-infrared light (approximately 1,300 nm) to discriminate between a red and white thrombus [1]. A red thrombus is a cell-rich structure and consists mainly of red blood cells. It indicates an irregular structure of low reflectivity and high attenuation of the signal, which scatters significantly at this wavelength. Intensity attenuation of a red thrombus is greater than that of a white thrombus with an irregular structure of high reflectivity and low attenuation of the signal [6]. In this study, as the percentage of RBCs from a blood clot increased, more signal attenuation was shown, which correlates with the above demonstration that RBC is the main factor to impact reflectivity and attenuation of an OCT signal.
Compositions of blood clots have been reported to be related to prognosis after endovascular treatment in stroke patients. RBC-rich clots, which are usually at the early stage of clot formation, are associated with successful recanalization of intra-arterial thrombectomy [7]. There is growing interest in identifying and developing devices that can be used to treat fibrin-rich clots (also called ‘tough clots’) [8]. One group recently evaluated the utility of a geometric clot extractor when performing in vitro thrombectomy of fibrin-rich clots and found that it was superior to Solitaire in retrieving these difficult clots [8]. Although OCT has been reported to detect small clots within the vessel lumen after neuroendovascular procedures [9], there are still no studies showing that OCT can be used to identify the nature of a clot (RBC or fibrin rich) in acute ischemic stroke patients. It is conceivable that with improvements in OCT technology for the neurovascular space, imaging of difficult clots with OCT and selection of devices based on signal characteristics (extent of OCT signal attenuation and length of a clot) could become more important; particularly in more difficult cases which are refractory to multiple passes.
The OCT imaging method has several limitations. First, partial volume effects exist in some circumstances. Second, saline or contrast infusion is required to flush the clot area for the test because the blood inside the artery causes significant signal attenuation in patients. Finally, it might be difficult to advance an OCT catheter across the clot if the vessel is completely occluded.
CONCLUSION
Different compositions of clots can be assessed by OCT. Fibrin-rich clots have a homogeneous signal with high penetration (low-back scattering), while RBC-rich clots can be recognized as superficially signal rich with low penetration (high-back scattering). There is a potential use of OCT for stroke embolus characterization, particularly when managing clots that are refractory to conventional techniques.
Notes
Fund
This work was supported by NIH grant NS105853 (Brinjikji).
Ethics Statement
This study was approved by the Institutional Review Board of Mayo Clinic.
Conflicts of Interest
The authors have no conflicts to disclose.
Author Contribution
Concept and design: YD and WB. Analysis and interpretation: YD, RK, DFK, and WB. Data collection: YD, MA, AME, DRJ, and DD. Writing the article: YD and MA. Critical revision of the article: WB. Final approval of the article: WB. Statistical analysis: YD. Obtained funding: WB. Overall responsibility: WB and AME.