Warning: mkdir(): Permission denied in /home/virtual/lib/view_data.php on line 81 Warning: fopen(/home/virtual/neurointervention/journal/upload/ip_log/ip_log_2024-03.txt): failed to open stream: No such file or directory in /home/virtual/lib/view_data.php on line 83 Warning: fwrite() expects parameter 1 to be resource, boolean given in /home/virtual/lib/view_data.php on line 84 Characteristic Signs on T2*-Based Imaging and Their Relationship with Results of Reperfusion Therapy for Acute Ischemic Stroke: A Systematic Review and Evidence to Date
Neurointervention Search

CLOSE


Neurointervention > Volume 13(2); 2018 > Article
Ko, Ryu, Yun, Koh, Shin, and Kim: Characteristic Signs on T2*-Based Imaging and Their Relationship with Results of Reperfusion Therapy for Acute Ischemic Stroke: A Systematic Review and Evidence to Date

Abstract

Purpose

Characteristic signs – the susceptibility vessel sign (SVS) and the prominent hypointense vessel sign (PHVS) – on T2*-based magnetic resonance imaging (T2*MRI) can be seen for acute ischemic stroke with large artery occlusion. In this study, we investigated the evidence to support our hypothesis that these findings may help to predict outcomes after reperfusion therapy.

Materials and Methods

We searched for papers describing SVS and PHVS in patients treated with reperfusion therapy for acute ischemic stroke, and their functional/radiologic outcomes were systematically reviewed.

Results

Nine studies on the SVS and six studies on the PHVS were included. The pooled odds ratio (OR) of recanalization after intravenous thrombolysis or mechanical thrombectomy was not significantly different with the presence of SVS (OR, 0.615; 95% confidence interval [CI], 0.335–1.131 and OR, 0.993; 95% CI, 0.629–1.567). The OR of favorable functional outcome after reperfusion therapy in terms of the presence of PHVS varied (0.083 to 1.831) by study.

Conclusion

Our meta-analysis of the published data showed that a SVS was not a predictive factor for recanalization after reperfusion therapy for acute ischemic stroke. Currently, the data available on T2*MRI are too limited to warrant reperfusion therapy in routine practice. More data are needed from studies with randomized treatment allocation to determine the role of T2*MRI.

INTRODUCTION

Magnetic inhomogeneity from iron and deoxyhemoglobin causes faster T2* relaxation, leading to signal intensity loss on T2*-based magnetic resonance images (MRI). Therefore, T2*-based MRI (T2*MRI), including the T2*-weighted gradient recalled echo imaging, or susceptibility weighted imaging, is highly sensitive for the detection of recent or old cerebral hemorrhage and is commonly used for stroke patients [1,2].
Although the detection of hemorrhage has been the critical role of T2*MRI, in the past decade, there has been a growing interest in additional supportive findings on T2*MRI that can be seen in patients with ischemic stroke with large artery occlusion. The susceptibility vessel sign (SVS) is defined as a hypointense signal that exceeds the diameter of the contralateral artery located at the site of the thrombus [3]. This sign is highly specific for vessel occlusion, and it also represents a recanalization prediction after intravenous tissue plasminogen activator thrombolysis (IVT) [4,5]. Abnormal hypointensity of cerebral veins is another specific finding after arterial occlusion [6]. This finding, called the prominent hypointense vessel sign (PHVS), is caused by an increase in deoxyhemoglobin and a decrease in oxyhemoglobin within the cerebral veins and tissue capillaries, leading to a signal drop along cerebral veins [7]. This local increase of deoxyhemoglobin might be an expression of the stress on tissue-at-risk. This potential metabolic information on T2*MRI may help to assess prognostic value-related clinical outcomes.
Recently, evidence of the clinical significance of microbleeds on T2*MRI has been well established for acute ischemic stroke. Two meta-analyses on T2*MRI for ischemic stroke revealed that microbleeds are a major risk factor of symptomatic parenchymal hemorrhage after intravenous thrombolysis [8,9]. In spite of the prognostic role of microbleeds on T2*MRI and its homogenous results in many studies, the clinical role of the other two characteristic signs on T2*MRI, SVS and PHVS, could not be concluded for reperfusion treatment for ischemic stroke.
Despite a considerable body of literature on the prognostic value of these two signs on T2*MRI, there have been conflicting results regarding the difference in outcome related to the two signs. There is a recognized need for multimodal MRI that can evaluate acute stroke with large artery occlusion, which could better select patients most likely to benefit from endovascular methods and exclude those who would fare worse or not benefit, particularly in extended time windows. However, careful verification should be given to whether T2*MRI is essential to multimodal MRI protocol for acute stroke. Therefore, we conducted this systematic review to assess all current evidence on the clinical predictability of SVS and PHVS in patients with acute ischemic stroke who were treated by reperfusion therapy and their outcomes.

MATERIALS AND METHODS

Searches

Meta-analyses were conducted in accordance with the guidelines for the meta-analysis of observational studies in epidemiology [10]. We conducted a systematic literature review of PubMed, EMBASE, and the Cochrane library databases from inception through May 30, 2018. The following keywords, and entrée terms analogous with these, were used for searching, in relevant combinations, using the Boolean operators OR and AND: “gradient-echo,” “T2*-weighted,” “susceptibility-weighted,” “ischemic stroke,” “mechanical thrombectomy,” “reperfusion,” “thrombolysis,” and “endovascular procedure” (Supplementary material).
The retrieved articles were then screened by title and abstract to identify all published observational or interventional studies that reported clinical/radiological outcomes according to T2*MRI for acute stroke managed with reperfusion treatment. Next, two researchers reviewed manuscripts in the screened articles for the inclusion criteria listed as follows: any study 1) in which enrolled patients underwent reperfusion treatment for acute ischemic stroke, such as IVT and/or endovascular mechanical thrombectomy (MT); 2) that performed T2*MRI before treatment for all subjects; 3) that reported clinical outcomes, such as recanalization or post-treatment modified Rankin scale (mRS), and hemorrhagic complications; 4) that had any description of the specific finding of T2*MRI and its relation with clinical outcomes; and 5) that enrolled more than 10 subjects. We excluded studies that reported duplicate data or that were limited in appropriate data. In addition, the reference lists of the included articles and background papers were reviewed for potentially relevant studies. We contacted the authors by e-mail if reported data were missing.

Data extraction

Two investigators independently assessed the eligibility, data abstraction, and methodological quality of studies using the aforementioned search criteria for studies, and all disagreements were resolved by consensus. The following data were abstracted from enrolled studies: report characteristics (first author’s name, year of publication, and name of trial); details of the study design (observational or controlled study, retrospective or prospective, and single or multicenter); characteristics of the cohort (age, sex, occlusion site, initial National Institutes of Health Stroke Scale [NIHSS] score, clinical risk factors, and cause of stroke); details of T2*MRI acquisition and interpretation (sequence, strength of magnetic field, repetition time, echo time, flip angle, and finding); details of reperfusion treatment (methods and time from onset to treatment), and outcomes (recanalization status and mRS at three months after treatment). The quality of the included studies was also independently assessed using the most recent quality assessment tool for diagnostic accuracy studies (QUADAS-2).

Statistical analysis

We summarized the study population demographics and proportions of each characteristic image finding on T2*MRI with the radiological and functional clinical outcomes or risk factors. The outcomes according to findings on T2*MRI were measured in terms of successful recanalization, favorable functional outcome, and the presence of hemorrhagic transformation. We defined successful recanalization as an arterial occlusive lesion scale 2 and 3 [11] or modified Mori scale 2 and 3 [12] on any radiological image measured within 24 hours after IVT or TICI 2b to 3 after MT. We defined a favorable functional outcome as mRS ≤2 (or 1) measured at three months after treatment. The prevalence of a stroke of cardioembolic cause was also assessed as the difference between a positive and negative SVS.
Odds ratios (ORs) and 95% confidence intervals (CIs) were used to determine the associations between positive T2*MRI findings, functional outcomes, and any influence of treatment. We aimed at comparing functional and radiological outcomes in patients with characteristic T2*MRI findings and determined whether reperfusion treatment changed the relationship between T2*MRI findings and clinical outcome. The ORs were pooled using a random-effects (Simonian and Laird) model. If there was a possibility that the pooled estimates would be confounded by substantial heterogeneity among the studies, the results were not pooled in order to prevent misinterpretation. The heterogeneity among the studies was assessed using the I2 statistic and publication bias was evaluated visually by funnel plots. To evaluate the pooled results’ stability, we conducted sensitivity analyses by removing studies with heterogeneity in the MRI sequence or inclusion criteria.

RESULTS

Study selection

During the initial search, 1,018 studies were identified, 954 were initially screened by title and abstract, and 65 were assessed via a full-text review for eligibility. A total of 15 studies presented a relationship between T2*MRI findings and clinical/radiological outcomes in ischemic stroke patients after reperfusion therapy [5,13-26]. One study was a randomized controlled trial, while the other enrolled studies were observational studies. No studies were considered to be seriously flawed as per the Quality Assessment Tool for Observational Cohort and Cross-Sectional Studies.

Study characteristics

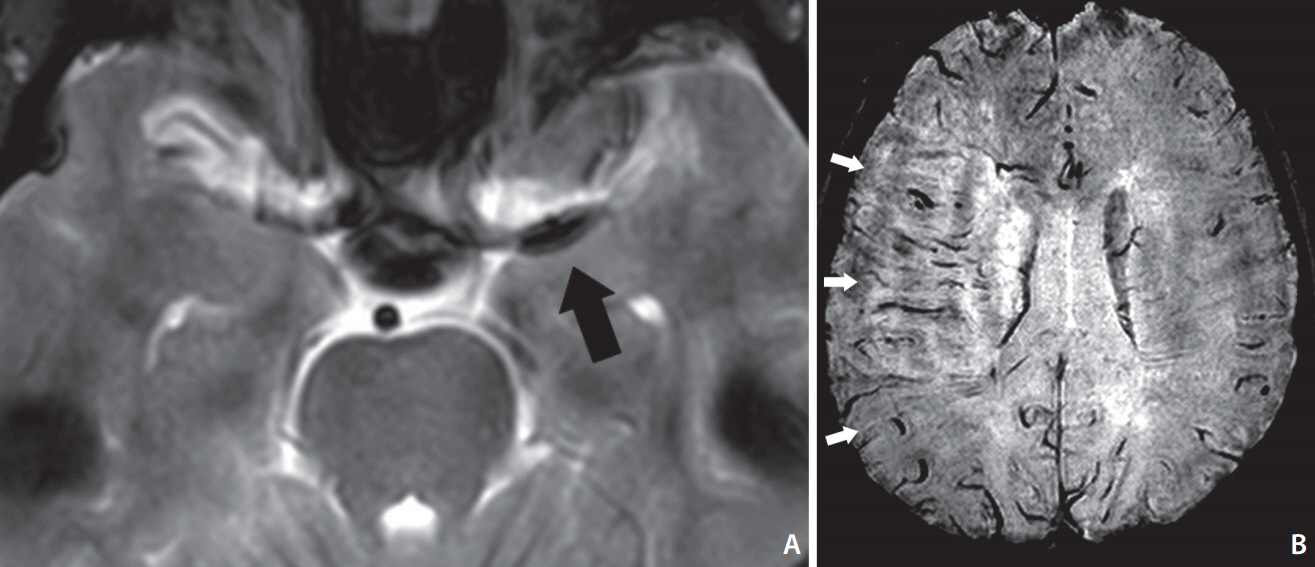
Among the 15 studies, nine analyzed the relation between SVS (Fig. 1A) and outcome from 896 subjects [5,13,15-20]. According to the method of reperfusion therapy, four studies enrolled only patients treated with IVT, and five studies enrolled patients treated with MT. Seven studies used gradient echo sequences, and two studies used SWI. Although most enrolled studies were limited to large artery occlusion for the including criteria, one study [13] enrolled medium size artery occlusion in their cohorts (1.6% of total subjects). Only 2.8% of total subjects with stroke were related to occlusion in the posterior circulation [18]. The mean/median value of the initial NIHSS was over 10 in most studies. Most of the studies used the general guideline of the time-window for IVT (3 to 4.5 hours) and MT (6 hours). Mechanical thrombectomy was performed with a stent retriever or an aspiration catheter in all enrolled studies. Of the nine SVS studies, recanalization status was presented in all, and favorable outcomes were measured in five. The incidence of cardioembolic-caused stroke according to the presence of SVS findings was evaluated in six of the eight studies (Table 1).
Although we enrolled six studies by consensus after reviewing the figures and contexts of each, the definition of prominent hypointense vessel signs (Fig. 1B) at the ipsilateral side of stroke and its assessing methods were not consistent in six studies [21-26]. Thus, we did not conduct the pooled analysis for studies of PHVS. PHVS was described differently in each study, such as cortical vessel sign, susceptibility-diffusion mismatch, brush sign, and as prominent medullary veins. Four studies qualitatively assessed the presence of PHVS on the ipsilateral side of stroke, and two studies quantitatively assessed the degree of PHVS. There was also significant heterogeneity in their inclusion criteria and reperfusion therapy methods of PHVS. Of the six studies of PHVS, functional outcomes were presented in all studies, and recanalization status was presented in only two. When comparing the positive and negative PHVS on T2*MRI, the ORs for favorable outcomes after reperfusion therapy varied from 0.083 to 1.831. More detailed clinical characteristics of each study are presented in Table 2.

Overall assessment of SVS on the outcomes of reperfusion therapy

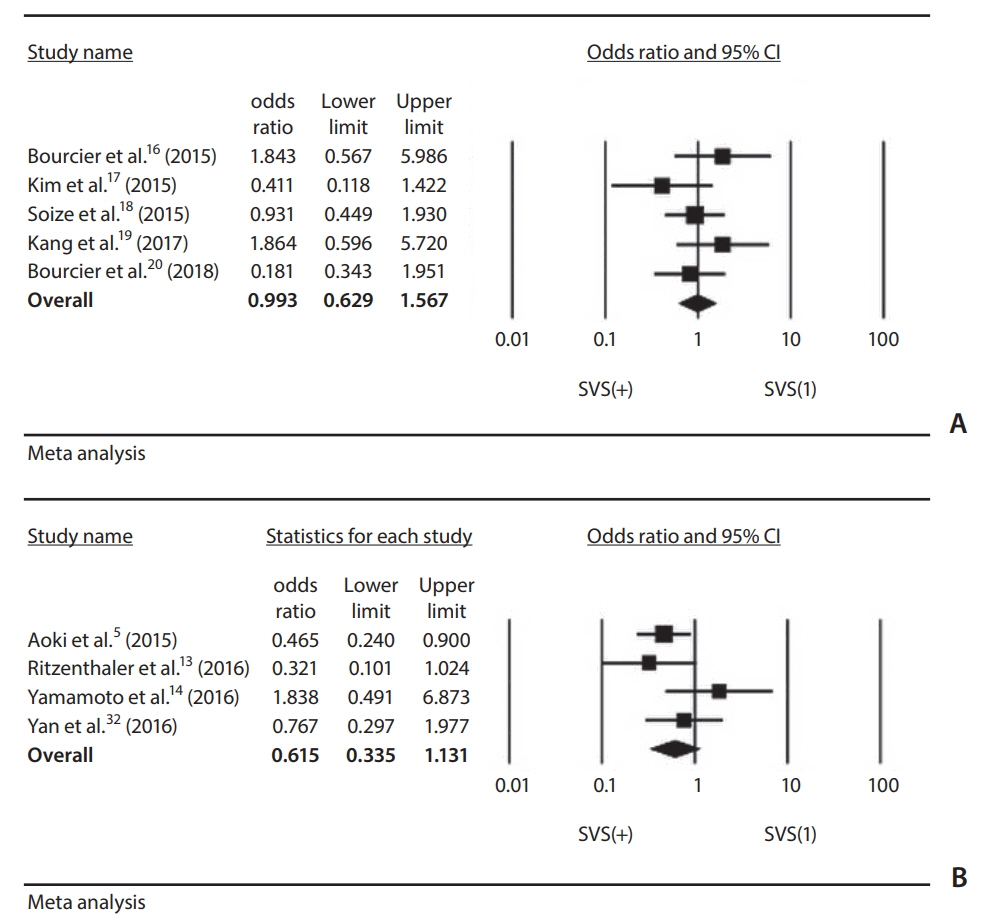
Nine studies revealed a relationship between presence of SVS and recanalization rate after reperfusion therapy. Meta-analysis did not show any significant differences in the recanalization rate after MT in relation to the presence of SVS on T2*MRI (OR, 0.993; 95% CI, 0.629–1.567; I2=8.6%). The pooled OR of recanalization after IVT also did not show a significant difference related to the presence of an SVS (OR, 0.615; 95% CI, 0.335–1.131; I2=36.2%) (Fig. 2). Significant publication bias was not observed on funnel plots (Supplementary Fig. 1). A sensitivity analysis showed that the robustness of the findings to the study centre was preserved regardless of the exclusion of any study.
Among the five studies of MT, we were able to extract data regarding the SVS and favorable functional outcomes only from three. Two of three studies presented a favorable outcome prevalence significant higher for a negative SVS than for a positive SVS (OR, 1.899 and 4.950), and one study showed the opposite result (OR, 0.375). The pooled estimate was not conducted due to significant heterogeneity (Table 3).
Six studies assessed the relationship between cardioembolic cause and the presence of an SVS on T2*MRI. A pooled estimate was not conducted because of significant heterogeneity through the studies. Two of six studies presented statistical significance in association between a positive SVS and a cardioembolic cause of stroke, and OR varied from 0.547 to 4.086 (Table 4).

DISCUSSION

This review highlighted the need for more data to confirm and refine the clinical benefits of T2*MRI for reperfusion therapy for acute ischemic stroke and for standardization of methods to assess T2*MRI lesions. We pooled the OR for recanalization according to SVS, and this result suggested that an SVS is not a predictive factor for recanalization. Despite many reports advocating characteristic findings on T2*MRI for ischemic stroke, there was very limited evidence that concluded whether the specific findings on T2*MRI provided predictive information for different outcomes from those without these findings and what the possible benefits of T2*MRI before treatment might be. These data were very fragmented and difficult to manage systematically, and there was little that was ultimately usable.

SVS

The presence of an SVS in thrombi can be related with the composition of a clot. Red blood cell (RBC) dominant clots have dominantly paramagnetic deoxygenated hemoglobin, which produces a non-uniform magnetic field on T2* sensitive sequences [27]. RBC dominant clots have a higher proportion of components (e.g., platelets) that are resistant to fibrinolytic agents alone, whereas fibrin-rich clots with a lack of SVS are responsive to fibrinolytic agents [28]. A study assessing the histologic analysis of retrieved clots found that the composition of RBC and fibrin in clots was different according to the origin of clot, whether cardioembolic or non-cardioembolic [29]. Therefore, it has been suggested that clot composition may affect its lysability and/or mechanical removal. In spite of this presumption, pooled estimates showed that endovascular recanalization was not related to SVS. Although several studies presented an association between clinical outcome and the histopathology of retrieved clots after mechanical thrombectomy for large artery occlusion [30,31], there is still a debate about this relation.
In spite of our results not showing the predictability of an SVS, we disagree that the clinical value of an SVS in reperfusion therapy for acute stroke should be disregarded. Recent studies about T2*MRI proposed other novel values of an SVS in standard reperfusion therapy for acute ischemic stroke. Several studies found that the clot burden measured by an SVS was associated with successful recanalization rate and favorable clinical outcomes [18,32]. This suggests that thrombus load is more important than thrombus composition for mechanical recanalization. The result of the ASTER trial that was used in our study showed that, when an SVS was present, successful reperfusion was more often achieved with a stent retriever than with a suction aspiration catheter as a first-line endovascular thrombectomy [20]. It remains a promising attempt and an interesting research question to further specify a strategy for mechanical thrombectomy according to SVS.

Prominent hypointense vessel signs

A possible explanation for the dropped signal marking the prominent vessel on T2*MRI is the increased oxygen extraction fraction and/or higher concentration of deoxyhemoglobin in the critically hypoperfused region compared to normal brain areas [33,34]. In this context, several studies assessed whether SWI was able to replace perfusion imaging, since both sequences might indicate a penumbra. Despite the presence of a PHVS in acute stroke patients, there has been a contradiction about using a PHVS to predict clinical outcomes. Some studies have shown that the presence of a PHVS predicts severe stroke and poor outcome [35,36]. On the contrary, some studies suggested even better outcome in subjects with a PHVS based on the assumption that this imaging marker represents collateralization [37]. Similarly, there is a debate whether a PHVS is related with the prognosis of acute ischemic stroke after reperfusion therapy. In the present review, we could not conclude the predictability of a PHVS in the prognosis of acute stroke after reperfusion therapy.

Limitations

The lack of standardization of the acquisition and description of T2*MRI was a major limitation of the evidence so far. Recent guidelines for the treatment of acute ischemic stroke advise the use of perfusion imaging only for selecting patients with an extended time-window. Unlike the hemodynamic parameter of perfusion imaging, a PHVS is difficult to measure quantitatively, so it is unlikely that it will be accepted as the standard work-up for hyperacute ischemic stroke. In spite of the difference in imaging acquisition technique between GRE and SWI, we enrolled the results without separation between these sequences. Although there has been no study that compared the diagnostic accuracy between the two techniques, several studies presented similar values for the sensitivities (70–80%) and specificities (over 90%) of GRE and SWI for detection of intracranial large artery thrombosis [38-40]. Interestingly, all of the included studies were performed in Far-East Asia (China, Korea, and Japan) or France. This may be related to the system of social health insurance, the accessibility of MRI scans, or the guidelines of treatment for acute ischemic stroke in each country.

CONCLUSION

Our systematic review and meta-analysis of T2*MRI for reperfusion therapy of acute ischemic stroke demonstrated only that there were no definitive associations between the presence of an SVS and successful recanalization rate after MT or IVT for acute ischemic stroke. Clearly, much work remains to be done to understand the association between an SVS and strategies for mechanical thrombectomy. To move forward, common standards and definitions for the T2*MRI protocol, the descriptions of SVS and PHVS, and the quantification of SVS and PHVS are needed.

SUPPLEMENTARY MATERIALS

Supplementary materials related to this article can be found online at https://doi.org/10.5469/neuroint.2018.01039.

Acknowledgments

This study was supported by the 2017 Korean Society of Interventional Neuroradiology (KSIN) research grant.

Fig. 1.
(A) Representative image of “susceptibility vessel sign” on T2*-weighted gradient recalled echo scan. In a patient with left MCA occlusion, there is a hypointense blooming artifact (black arrow) beyond parent vessel lumen. (B) Representative image of “prominent hypointense vessel sign” on minimum intensity projection of susceptibility-weighted scan. The image of patient with right MCA occlusion shows multiple hypointense linear and branched vessels (white arrows) in the MCA territory. MCA, middle cerebral artery.
neuroint-2018-01039f1.jpg
Fig. 2.
(A) Forest plot showing odds ratio for recanalization after mechanical thrombectomy for acute stroke in comparison of a positive SVS and a negative SVS. The size of the black box corresponding to each study is proportional to the sample size. The horizontal line shows the corresponding 95% CI of the effect size (odds ratio). The combined estimate is based on a randomized-effects model shown by the diamond. The pooled estimate of odds ratios did not favor either of two arms. (B) Forest plot showing odds ratio for recanalization after intravenous thrombolysis for acute stroke in comparison of a positive SVS and a negative SVS. The pooled estimate of odds ratios did not favor either of two arms. SVS, susceptibility vessel sign; CI, confidence interval.
neuroint-2018-01039f2.jpg
Table 1.
Characteristics of study design, T2*-based MRI, cohorts, and reperfusion therapy in studies for SVS
Study Region Type Site Magnetic field T2* sequence; TR/TE/FL Slice thickness Reperfusion therapy LAO No. ICA Age (years) I-NIHSS Onset-to-Tx (IVT or puncture)
Aoki et al. [5] (2015) Japan Retro Single 1.5T GRE; 700/20/NA 6 mm IVT All 158 43 (27%) 78 (71-84) 16 (10-20) 146.9±40.8
Ritzenthaler et al. [13] (2016) France Pros Multi NA GRE; 800/28/20 5 mm IVT 36 (72%) 50 18 (36%) 70 (64-77) 14 (7-17) 165 (141-198)
Yamamoto et al. [14] (2016) Japan Retro Single 3T GRE; NA NA IVT All 49 6 (12%) 73.7±10.7 15.2±6.1 140.4±37.8
Yan et al. [15] (2016) China Retro Single 3T SWI; 58/4.5/20 2 mm IVT All 85 0 66 (43-94) 14 (7-17) 235±82
Bourcier et al. [16] (2015) France Retro Single 1.5T GRE; 800/30/20 5 mm MT (bridge 54.8%) All 73 39 (53%) 59 (25-85) 18 (2-27) 247.6
Kim et al. [17] (2015) Korea Retro Single 1.5T GRE; 750-800/14/20 4 mm MT (bridge 62.2%) All 37 NA 68.7±11.4 15 (5-19) 245.4±95.3
Soize et al. [18] (2015) France Retro Multi 1.5 or 3T GRE; NA NA MT (bridge 54.9%) All 153 35 (23%) 59±17 17.2±6.5 289±173
Kang et al. [19] (2017) Korea Retro Single 1.5 or 3T SWI; 38/23/25, 28/20/15 4, 3 mm MT (bridge 39.3%) All 89 18 (20%) 68±13 15 (9-18.5) 354.0±19.8
Bourcier et al. [20] (2018) France Pros, RCT Multi NA GRE; NA NA MT (bridge 65.3%) All 202 65 (32%) 67.7±15.3 15.5±6.3 225.2±79.4

MRI, magnetic resonance imaging; SVS, susceptibility vessel sign; TR/TE/FL, repetition time/echo time/flip angle; LAO, large artery occlusion; ICA, internal carotid artery; I-NIHSS, initial National Institutes of Health Stroke Scale; Tx, treatment; IVT, intravenous thrombolysis; Retro, retrospective design; GRE, gradient-recalled echoT2*weighted imaging; Pros, prospective design; NA, not applicable; SWI, susceptibility weighted imaging; MT, mechanical thrombectomy; bridge, IVT prior to MT; RCT, randomized controlled trial.

Table 2.
Characteristics of study design, T2*-based MRI, cohorts, and reperfusion therapy in studies for PHVS
Study Region Type Site Magnetic field T2* sequence; TRATE/FL Slice thickness Reperfusion therapy LAO No. ICA Age (years) l-NIHSS Onset-to-Tx (IVT or puncture) Sign and assessing methods OR (95% Cl) for favorable outcome P-value
Baik et al. [21] (2012) Korea Retro Single 1.5 or 3T SWi; 28/20/15 2 mm MT (2 intraarterial thrombolysis) All 19 8 (42%) 59(IQR, 55-71) 15(IQR, 12-20) 150(IQR, 90-300) Cortical vessel sign, asymmetry between bilateral side 0.667 (0.084-5.301) 0.702
Lou et al. [22] (2014) China R/Pc Single 3T SWI; 58/5/20 2 mm IVT All 54 NA 69±13 12(5-7) 228.5±63.8 S-D mismatch, asymmetry index 1.831 (0.618-5.425) 0.275
Terasawa et al. [23] (2014) Japan R/Pc Single 3T GRE; 400/28/25 6 mm IVT All 36 0 74.7± 10.6 14±5 142.0±30.6 Brush sign, the presence 0.379 (0.085-1.699) 0.205
Zhanq et al. [24] (2017) China Retro Single 3T SWI; 58/4.5/20 2 mm IVT 60 (55%) 109 NA 68±13 79.0±7.0 230(180-283) Thalamostriate vein sign, the presence 0.204 (0.086-0.483) 0.000
Zhao et al. [25] (2017) China Retro Single 3T SWi; 27/20/NA 1.5 mm IVT NA 60 NA 62.3±12.4 12.3±4.1 214.0±64.2 Cortical vessel sign, asymmetry between bilateral side 0.579 (0.173-1.934) 0.374
Wang et al. [26] (2018) China Retro Single 3T SWI; 37.9/24.3/NA 1.6 mm IVT (52%) and MT (48%) All 25 NA NA NA NA PHVS, the presence 0.083 (0.007-0.931) 0.044

MRI, magnetic resonance imaging; PHVS, prominent hypointense vessel sign; TR/TE/FL, repetition time/echo time/flip angle; LAO, large artery occlusion; ICA, internal carotid artery; I-NIHSS, initial National Institutes of Health Stroke Scale; Tx, treatment; IVT, intravenous thrombolysis; OR, odds ratio; CI, confidence interval; Retro, retrospective design; SWI, susceptibility weighted imaging; MT, mechanical thrombectomy; IQR, interquartile range; R/Pc, retrospective observation of prospective registry; NA, not applicable; S-D mismatch; susceptibility-diffusion mismatch; GRE, gradient-recalled echoT2*weighted imaging.

Table 3.
OR for favorable functional outcome in patients with positive SVS compared to negative SVS
Study Reperfusion Tx OR (95% CI) P-value
Aoki et al. [5] (2015) IVT 0.929 (0.388-2.228) 0.869
Bourcier et al. [16] (2015) MT 4.950 (1.560-15.704) 0.007
Kim et al. [17] (2015) MT 0.375 (0.159-0.882) 0.025
Bourcier et al. [20] (2018) MT 1.899 (1.022-3.530) 0.043

OR, odds ratio; SVS, susceptibility vessel sign; Tx, treatment; CI, confidence interval; IVT, intravenous thrombolysis; MT, mechanical thrrombectomy.

Table 4.
Cardioembolic cause of stroke and susceptibility vessel sign
Study Reperfusion Tx MR sequence OR (95% CI) P-value
Aoki et al. [5] (2015) IVT GRE 1.477 (0.772—2.827) 0.239
Ritzenthaler et al. [13] (2016) IVT GRE 0.547 (0.170-1.758) 0.312
Yan et al. [15] (2016) IVT SWI 1.259 (0.489-3.244) 0.633
Kim et al. [17] (2015) MT GRE 4.086 (1.673-9.982) 0.002
Kang et al. [19] (2017) MT SWI 3.675 (1.306-10.343) 0.014
Bourcier et al. [20] (2018) MT GRE 0.978 (0.525-1.823) 0.945

Tx, treatment; MR, magnetic resonance; OR, odds ratio; CI, confidence interval; IVT, intravenous thrombolysis; GRE, gradient-recalled echoT2*weighted imaging; SWI, susceptibility weighted imaging; MT, mechanical thrombectomy.

REFERENCES

1. Chavhan GB, Babyn PS, Thomas B, Shroff MM, Haacke EM. Principles, techniques, and applications of T2*-based MR imaging and its special applications. Radiographics 2009;29:1433-1449.
crossref pmid pmc
2. Tsai FY, Kao HW, Tsui YK, Hasso AN, Greensite F. Susceptibility weighted imaging and cerebrovascular disorders. Neuroradiol J 2011;24:121-127.
crossref pmid
3. Kimura K, Iguchi Y, Shibazaki K, Watanabe M, Iwanaga T, Aoki J. M1 susceptibility vessel sign on T2* as a strong predictor for no early recanalization after IV-t-PA in acute ischemic stroke. Stroke 2009;40:3130-3132.
crossref pmid
4. Yan S, Hu H, Shi Z, Zhang X, Zhang S, Liebeskind DS, et al. Morphology of susceptibility vessel sign predicts middle cerebral artery recanalization after intravenous thrombolysis. Stroke 2014;45:2795-2797.
crossref pmid
5. Aoki J, Kimura K, Shibazaki K, Saji N, Uemura J, Sakamoto Y, et al. The susceptibility vessel sign at the proximal M1: a strong predictor for poor outcome after intravenous thrombolysis. J Neurol Sci 2015;348:195-200.
crossref pmid
6. Kao HW, Tsai FY, Hasso AN. Predicting stroke evolution: comparison of susceptibility-weighted MR imaging with MR perfusion. Eur Radiol 2012;22:1397-1403.
crossref pmid
7. Lee JM, Vo KD, An H, Celik A, Lee Y, Hsu CY, et al. Magnetic resonance cerebral metabolic rate of oxygen utilization in hyperacute stroke patients. Ann Neurol 2003;53:227-232.
crossref pmid
8. Charidimou A, Turc G, Oppenheim C, Yan S, Scheitz JF, Erdur H, et al. Microbleeds, cerebral hemorrhage, and functional outcome after stroke thrombolysis: individual patient data meta-analysis. Stroke 2017;48:2084-2090.
crossref pmid
9. Charidimou A, Shoamanesh A, International Meta-Microbleeds Initiative. Clinical relevance of microbleeds in acute stroke thrombolysis: comprehensive meta-analysis. Neurology 2016;87:1534-1541.
crossref pmid
10. Stroup DF, Berlin JA, Morton SC, Olkin I, Williamson GD, Rennie D, et al. Meta-analysis of observational studies in epidemiology: a proposal for reporting. Meta-analysis Of Observational Studies in Epidemiology (MOOSE) group. JAMA 2000;283:2008-2012.
crossref pmid
11. Zaidat OO, Yoo AJ, Khatri P, Tomsick TA, von Kummer R, Saver JL, et al. Recommendations on angiographic revascularization grading standards for acute ischemic stroke: a consensus statement. Stroke 2013;44:2650-2663.
crossref pmid pmc
12. Mori E, Minematsu K, Nakagawara J, Yamaguchi T, Sasaki M, Hirano T, et al. Effects of 0.6 mg/kg intravenous alteplase on vascular and clinical outcomes in middle cerebral artery occlusion: Japan Alteplase Clinical Trial II (J-ACT II). Stroke 2010;41:461-465.
crossref pmid
13. Ritzenthaler T, Lacalm A, Cho TH, Maucort-Boulch D, Klaerke Mikkelsen I, Ribe L, et al. Sequential MR assessment of the susceptibility vessel sign and arterial occlusion in acute stroke. J Neuroimaging 2016;26:355-359.
crossref pmid
14. Yamamoto N, Satomi J, Harada M, Izumi Y, Nagahiro S, Kaji R. Is the susceptibility vessel sign on 3-tesla magnetic resonance T2*-weighted imaging a useful tool to predict recanalization in intravenous tissue plasminogen activator? Clin Neuroradiol 2016;26:317-323.
crossref pmid pdf
15. Yan S, Liu K, Tong L, Yu Y, Zhang S, Lou M. Different risk factors for poor outcome between patients with positive and negative susceptibility vessel sign. J Neurointerv Surg 2016;8:1001-1005.
crossref pmid
16. Bourcier R, Volpi S, Guyomarch B, Daumas-Duport B, Lintia-Gaultier A, Papagiannaki C, et al. Susceptibility vessel sign on MRI predicts favorable clinical outcome in patients with anterior circulation acute stroke treated with mechanical thrombectomy. AJNR Am J Neuroradiol 2015;36:2346-2353.
crossref pmid pmc
17. Kim SK, Yoon W, Heo TW, Park MS, Kang HK. Negative susceptibility vessel sign and underlying intracranial atherosclerotic stenosis in acute middle cerebral artery occlusion. AJNR Am J Neuroradiol 2015;36:1266-1271.
crossref pmid pmc
18. Soize S, Batista AL, Rodriguez Regent C, Trystram D, Tisserand M, Turc G, et al. Susceptibility vessel sign on T2* magnetic resonance imaging and recanalization results of mechanical thrombectomy with stent retrievers: a multicentre cohort study. Eur J Neurol 2015;22:967-972.
crossref pmid
19. Kang DW, Jeong HG, Kim DY, Yang W, Lee SH. Prediction of stroke subtype and recanalization using susceptibility vessel sign on susceptibility-weighted magnetic resonance imaging. Stroke 2017;48:1554-1559.
crossref pmid pmc
20. Bourcier R, Mazighi M, Labreuche J, Fahed R, Blanc R, Gory B, et al. Susceptibility vessel sign in the ASTER trial: higher recanalization rate and more favourable clinical outcome after first line stent retriever compared to contact aspiration. J Stroke 2018;20:268-276.
crossref pmid pmc pdf
21. Baik SK, Choi W, Oh SJ, Park KP, Park MG, Yang TI, et al. Change in cortical vessel signs on susceptibility-weighted images after full recanalization in hyperacute ischemic stroke. Cerebrovasc Dis 2012;34:206-212.
crossref pmid
22. Lou M, Chen Z, Wan J, Hu H, Cai X, Shi Z, et al. Susceptibility-diffusion mismatch predicts thrombolytic outcomes: a retrospective cohort study. AJNR Am J Neuroradiol 2014;35:2061-2067.
crossref pmid pmc
23. Terasawa Y, Yamamoto N, Morigaki R, Fujita K, Izumi Y, Satomi J, et al. Brush sign on 3-T T2*-weighted MRI as a potential predictor of hemorrhagic transformation after tissue plasminogen activator therapy. Stroke 2014;45:274-276.
crossref pmid
24. Zhang X, Zhang S, Chen Q, Ding W, Campbell BCV, Lou M. Ipsilateral prominent thalamostriate vein on susceptibility-weighted imaging predicts poor outcome after intravenous thrombolysis in acute ischemic stroke. AJNR Am J Neuroradiol 2017;38:875-881.
crossref pmid pmc
25. Zhao G, Sun L, Wang Z, Wang L, Cheng Z, Lei H, et al. Evaluation of the role of susceptibility-weighted imaging in thrombolytic therapy for acute ischemic stroke. J Clin Neurosci 2017;40:175-179.
crossref pmid
26. Wang Y, Shi T, Chen B, Lin G, Xu Y, Geng Y. Prominent hypointense vessel sign on susceptibility-weighted imaging is associated with clinical outcome in acute ischaemic stroke. Eur Neurol 2018;79:231-239.
crossref pmid
27. Kim SK, Yoon W, Kim TS, Kim HS, Heo TW, Park MS. Histologic analysis of retrieved clots in acute ischemic stroke: correlation with stroke etiology and gradient-echo MRI. AJNR Am J Neuroradiol 2015;36:1756-1762.
crossref pmid pmc
28. Jang IK, Gold HK, Ziskind AA, Fallon JT, Holt RE, Leinbach RC, et al. Differential sensitivity of erythrocyte-rich and platelet-rich arterial thrombi to lysis with recombinant tissue-type plasminogen activator. A possible explanation for resistance to coronary thrombolysis. Circulation 1989;79:920-928.
crossref pmid
29. Sporns PB, Hanning U, Schwindt W, Velasco A, Minnerup J, Zoubi T, et al. Ischemic stroke: what does the histological composition tell us about the origin of the thrombus? Stroke 2017;48:2206-2210.
crossref pmid
30. Hashimoto T, Hayakawa M, Funatsu N, Yamagami H, Satow T, Takahashi JC, et al. Histopathologic analysis of retrieved thrombi associated with successful reperfusion after acute stroke thrombectomy. Stroke 2016;47:3035-3037.
crossref pmid
31. Maekawa K, Shibata M, Nakajima H, Mizutani A, Kitano Y, Seguchi M, et al. Erythrocyte-rich thrombus is associated with reduced number of maneuvers and procedure time in patients with acute ischemic stroke undergoing mechanical thrombectomy. Cerebrovasc Dis Extra 2018;8:39-49.
crossref pmid pmc
32. Yan S, Lou M. Abstract W P43: extent of “blooming effect” predicts middle cerebral artery recanalization after intravenous thrombolysis. Stroke 2015;46(Suppl_1):AWP43
crossref
33. Huang P, Chen CH, Lin WC, Lin RT, Khor GT, Liu CK. Clinical applications of susceptibility weighted imaging in patients with major stroke. J Neurol 2012;259:1426-1432.
crossref pmid
34. Kesavadas C, Thomas B, Pendharakar H, Sylaja PN. Susceptibility weighted imaging: does it give information similar to perfusion weighted imaging in acute stroke? J Neurol 2011;258:932-934.
crossref pmid
35. Chen CY, Chen CI, Tsai FY, Tsai PH, Chan WP. Prominent vessel sign on susceptibility-weighted imaging in acute stroke: prediction of infarct growth and clinical outcome. PLoS One 2015;10:e0131118.
crossref pmid pmc
36. Sun W, Liu W, Zhang Z, Xiao L, Duan Z, Liu D, et al. Asymmetrical cortical vessel sign on susceptibility-weighted imaging: a novel imaging marker for early neurological deterioration and unfavorable prognosis. Eur J Neurol 2014;21:1411-1418.
crossref pmid
37. Dejobert M, Cazals X, Annan M, Debiais S, Lauvin MA, Cottier JP. Susceptibility-diffusion mismatch in hyperacute stroke: correlation with perfusion-diffusion mismatch and clinical outcome. J Stroke Cerebrovasc Dis 2016;25:1760-1766.
crossref pmid
38. Agarwal A, Vijay K, Thamburaj K, Kanekar S, Kalapos P. Sensitivity of 3D gradient recalled echo susceptibility-weighted imaging technique compared to computed tomography angiography for detection of middle cerebral artery thrombus in acute stroke. Neurol Int 2014;6:5521
crossref pmid pmc
39. Naggara O, Raymond J, Domingo Ayllon M, Al-Shareef F, Touzé E, Chenoufi M, et al. T2* “susceptibility vessel sign” demonstrates clot location and length in acute ischemic stroke. PLoS One 2013;8:e76727.
crossref pmid pmc
40. Rovira A, Orellana P, Alvarez-Sabín J, Arenillas JF, Aymerich X, Grivé E, et al. Hyperacute ischemic stroke: middle cerebral artery susceptibility sign at echo-planar gradient-echo MR imaging. Radiology 2004;232:466-473.
crossref pmid


ABOUT
ARTICLE CATEGORY

Browse all articles >

BROWSE ARTICLES
AUTHOR INFORMATION
Editorial Office
#705-2C, 9 Gangnam-ro, Giheung-gu, Yongin-si, Gyeonggi-do 16977, KOREA
Tel: +82-31-994-4382    Fax: +82-2-2275-9198    E-mail: editor@neurointervention.org                

Copyright © 2024 by Korean Society of Interventional Neuroradiology.

Developed in M2PI

Close layer
prev next